xSuite Invoice Forecast App with the Prediction Server (SAP Fiori)
Historical and forecast data is output in the xSuite Invoice Forecast App.
After opening the app, a company code and a vendor must be specified. Invoice Forecast data is retrieved at the back-end for this company code and supplier.
If Invoice Forecast data is available, this data will include the number of invoices per month, the average sums for invoices per month, and the sum total for invoices per month.
The historical part of the data covers the last 24 months. The forecast data covers the upcoming 12 months.
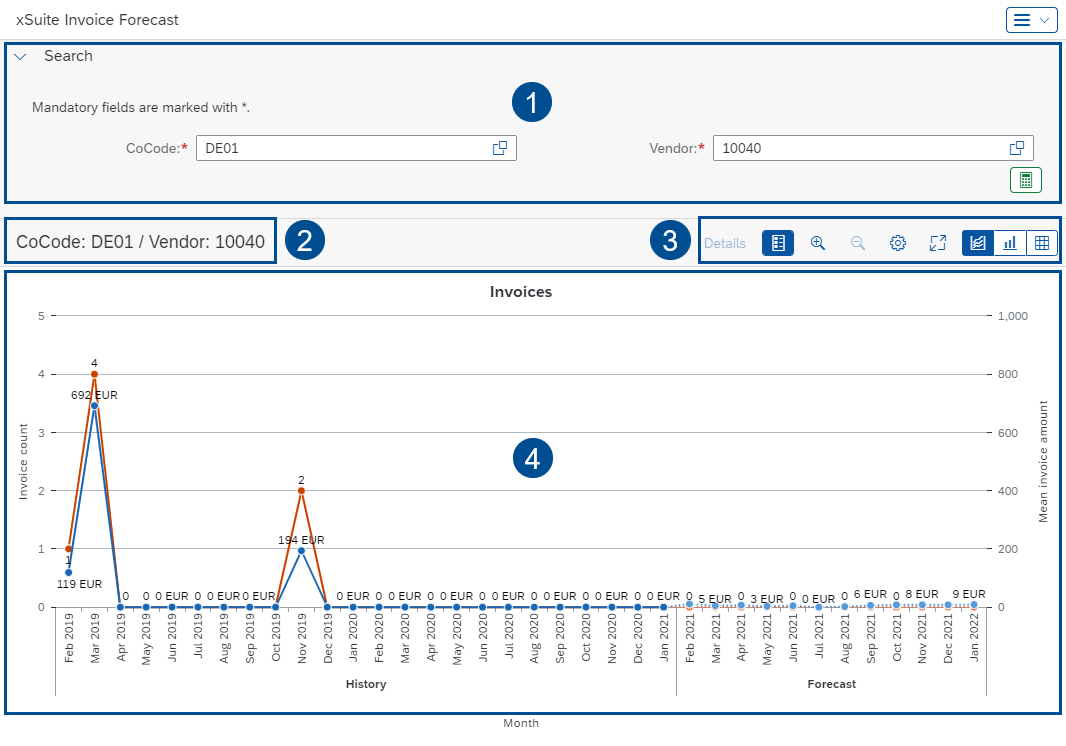
UI elements in the xSuite Invoice Forecast App
 |
No. | Area | Description | |
|---|---|---|---|
1 | Search | The upper area of the page comprises the search form. The search form can be expanded and collapsed with a click on the Search header. | |
2 | CoCode / Vendor | Indicates the company code-vendor combination for which the data is output. | |
3 | Buttons | See Overview of the buttons in the xSuite Invoice Forecast App. | |
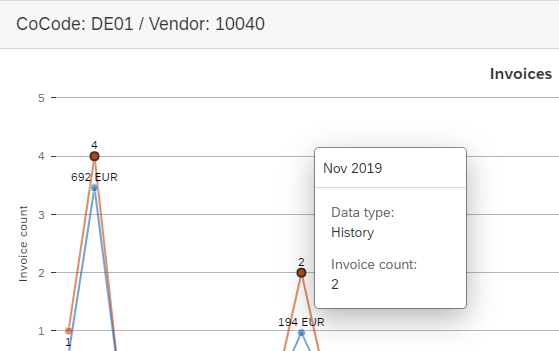
4 | Data output | Data is output in two diagrams and one table. The first diagram graphically represents the number of invoices and the average sum for invoices. The second diagram represents the sum total for invoices. The table outputs all data in tabular form. In the charts, clicking on a data point will open a pop-up that displays the data for that data point. If another pop-up is open at the same time, it will be closed automatically so that only one pop-up is open at a time.
|
Overview of the buttons in the xSuite Invoice Forecast App
Button | Name | Description | |
|---|---|---|---|
-- | Details | The Details button is only available in the diagrams. To click the button, a minimum of one data point must have been selected in the diagram. Clicking on this button will display all the data of the data points selected. 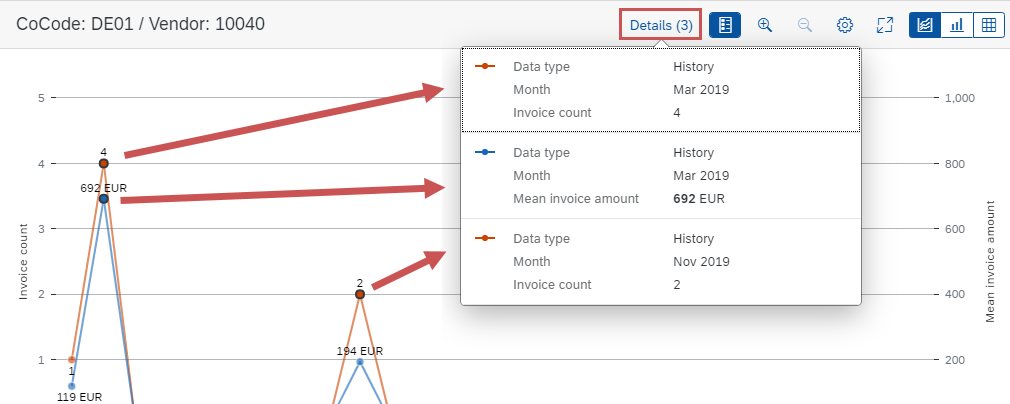 | |
 | Legend | Shows or hides the legend. The button is available only when displaying diagrams. | |
 | Zoom In | Enlarges screen contents. The button is available only when displaying diagrams. | |
 | Zoom Out | Shrinks screen contents. The button is available only when displaying diagrams. | |
 | Personalize | Determines which of the two data lines is displayed: Both data lines, invoice count only, or average sum for invoices only. The button only appears in the Invoice Count and Average Invoice Amount diagram. | |
 | Open Full Screen | Enables or disables full screen mode. In full screen mode, the search pane is hidden. | |
| Show diagram | Opens the Invoice Count and Average Invoice Amountchart. | |
| Show diagram | Opens the Total Invoice chart. | |
| Show table | Opens tabular representation of the data. |


