Capture Analyzer Interface SD
The xFlow SD Capture Analyzer is an add-on product of the xFlow product family. The xFlow SD Capture Analyzer enables detailed analysis of incoming documents for xFlow Interface. In just a few steps, you can perform analysis based on the following:
Analysis by sales organization
Analysis by distribution channel
Analysis by division
Analysis by SAP user
Analysis of changes made to the document
You can use the xFlow SD Capture Analyzer to perform a detailed analysis of the xFlow Orders Capture process. Based on the analysis, optimization potential can be identified and the appropriate changes made.
Authorizations
The xFlow SD Capture Analyzer is managed via authorization for invocation of Transaction /WMD/FP_SD_STAT. If authorization has not been granted, it can also be called with transactions SE38 and SE80. Authorizations for these transactions are set with SAP authorization management.
Options
The xFlow SD Capture Analyzer is invoked with Transaction /WMD/FP_SD_STAT. The following selection screen will open:
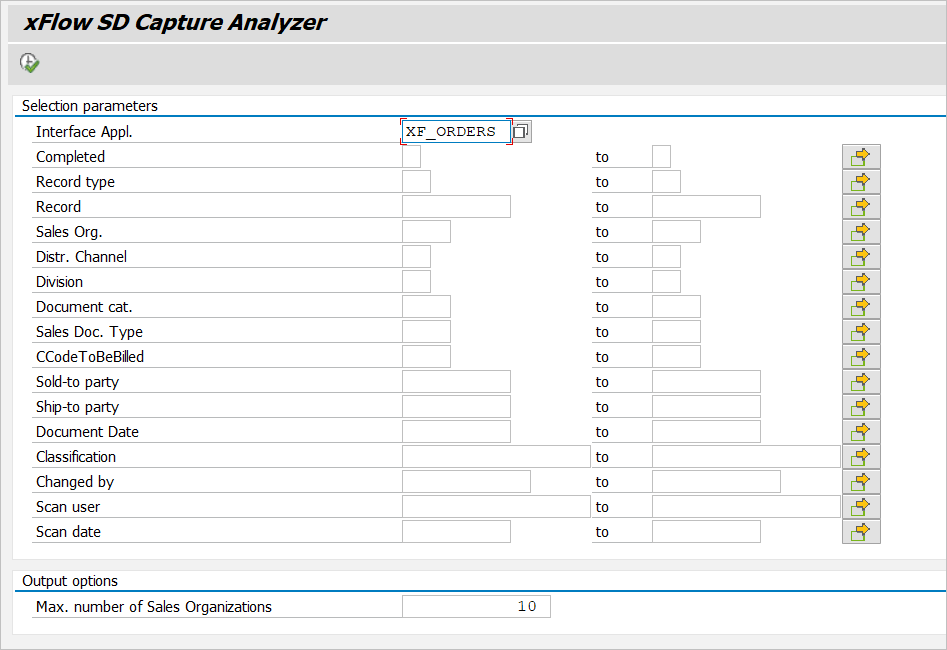
The selection parameters for xFlow data records from the following header and line-item tables can be applied:
/WMD/FP_IFSDH
/WMD/FP_SDHD
/WMD/FP_IFSDI
Make your selection and execute with  or F8, and a screen will open showing the results.
Data Output
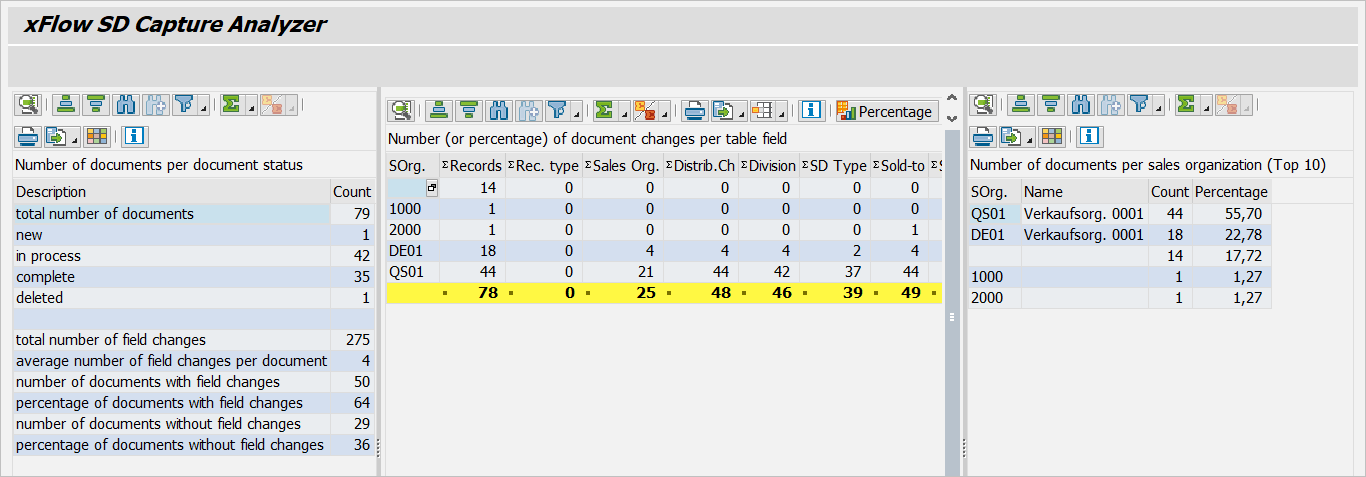
The xFlow SD Capture Analyzer data output displays the hit list resulting from the selection made in the options screen. The output represents the status at the time of selection.
The three tables presented are as follows:
Number of documents per document status
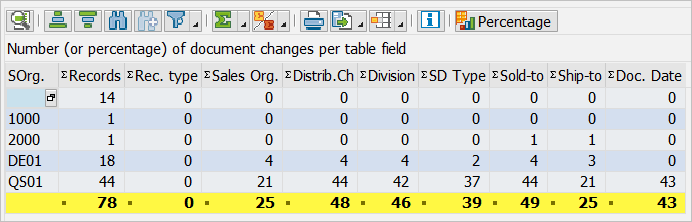
Number (or percentage) of document changes per table field
Number of documents per sales organization
Functions known from SAP such as Sort-in, Filter, Total, Print, Export, etc. can be used in the xFlow SD Capture Analyzer.
Button | Description |
|---|---|
| Detailed view of selected rows |
| Sort selection in ascending order |
| Sort selection in descending order |
| Find |
| Continue search |
| Set filter |
| Total |
| |
| Views |
| Export |
| Change layout |
| Access xFlow Invoice Overview (if possible) |
| Show diagram of selection |
| Display VKORG data or user data (if possible) |


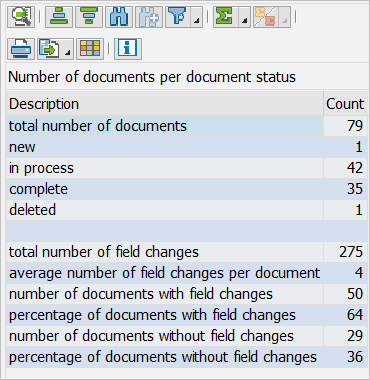
Number of Documents per Document Status
The table on the left side shows the number of documents by document status. The number of field changes is based on a comparison of the following tables:
SD Interface | SD Document |
|---|---|
Header: /WMD/FP_IFSDI | Header: /WMD/FP_SDHD |
Line item: /WMD/FP_IFSDI | Line item: /WMD/FP_SDIT |
In the interface tables on the left side, the data is transferred directly from xFlow Interface Windows — no changes have been made here. The tables on the right side contain the final values as they were edited in the xFlow Interface SAP. These values may have been changed. As soon as a document is opened in xFlow Interface SAP or is processed, possibly by a program entered in the record-type customizing, the data is written to the tables in the columns on the right.
A comparison between the left and right tables allows tracking of differences that have arisen from the entry of the document up to the point that it has been changed or processing has been finalized. If changes are made, therefore, they can be tracked in the comparison of the two tables.
Line | Description |
|---|---|
Total number of documents | The number of all documents according to table /WMD/FP_SDHD. |
new | The number of documents that are not yet in the validation step (those which are listed in the table /WMD/FP_IFSDH but not in the table /WMD/FP_SDHD) |
in process | Documents which are being processed, e.g., in the xFlow Interface Workflow, (all documents that have not been parked or posted) |
complete | The number of documents that have been parked or posted in xFlow Interface |
deleted | Deleted documents in xFlow Interface (all documents that have been flagged for deletion) |
total number of field changes | The number of field changes across all documents (as relates to the tables mentioned above) |
average number of field changes per document | The number of field changes across all documents (as relates to the tables mentioned above) |
number of documents with field changes | The number of documents that contain field changes (as relate to the tables listed above) |
percentage of documents with field changes | The percentage of documents in which changes have been made to fields (number of documents with field changes / total number of documents) |
number of documents with field changes | The number of runs per document in which changes to fields have not been made (as relate to the tables mentioned above) |
percentage of documents without field changes | The percentage of documents in which changes have not been made to fields (number of documents without field changes / total number of documents) |
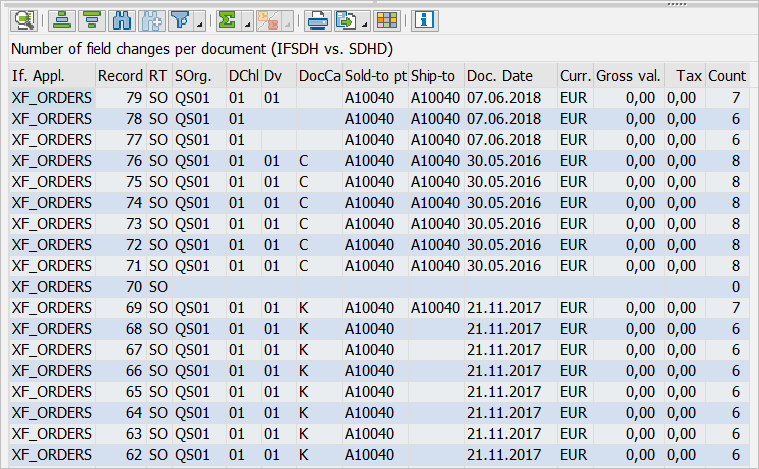
Double-click on a line to open the table view in the lower section of the screen Number of field changes per document, in which the tables IFSDH and SDHD are displayed alongside each other.
In the middle table, the number of table changes per table field is displayed for each table field. In the standard version, it is categorized by sales organization. This way, individual sales organizations can be compared with each other.
Click on the Percentage button to toggle between the following views:
Number (documents with field changes)
Percentage (documents with field changes)
Inverse percentage (documents without field changes)
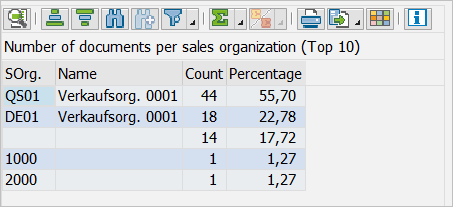
Number of Documents per Sales Organization
The table on the right side shows the number of documents by sales organization. It is sorted in descending order by the number of documents. If the selection screen in the search field "Maximum number of sales organizations" does not contain anything else, the top 10 sales organizations will be displayed. In the column on the right side, the percentage displayed is based on the overall number of documents resulting from the selection.
Average Number of Field Changes per Document (IFSDH vs. SDHD)
The table view at the bottom of the screen, Average Number of Field Changes per Document (IFSDH vs. SDHD), can be called by double-clicking on a line in the upper table.
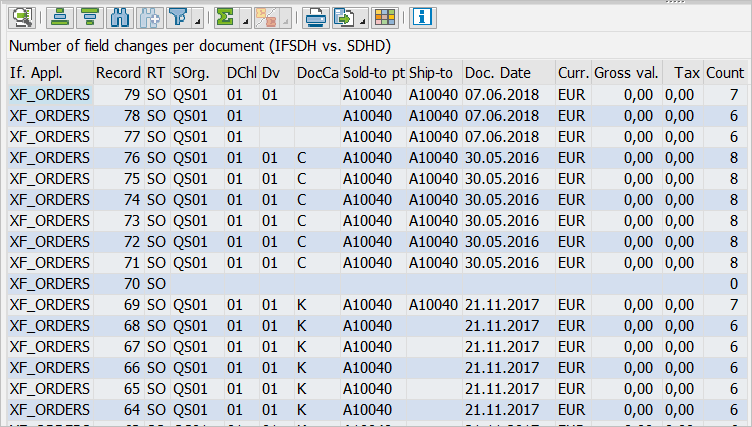
The following data is displayed for each xFlow document:
Application
Record number
Record type
Sales organization
Distribution channel
Division
Sales document type
Sold-to party
Ship-to party
Document date
Currency
Gross amount
Tax amount
Number of field changes
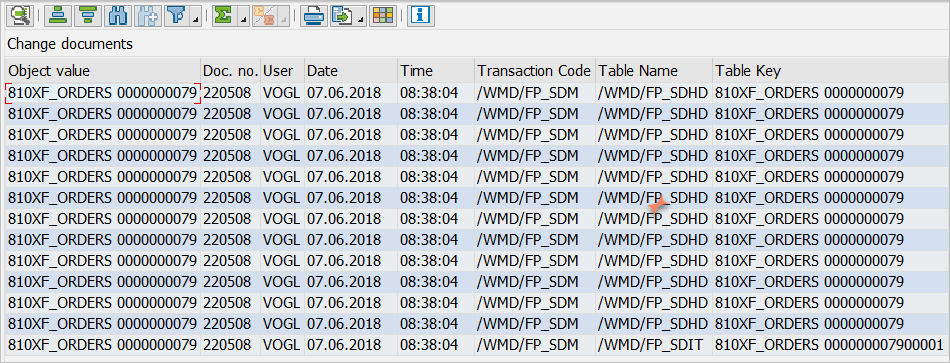
Change Documents
Display the change documents for the different xFlow record with a double-click on a field in the column to the right, Number. Since writing the change documents has not been implemented until xFlow Interface Version 5, change documents cannot be displayed for documents that were created with old versions.
Double-click on a field in one of the other columns (not Number) to access the xFlow Interface document directly. The documents related to the current line will be displayed in view mode.