Logging
The xSuite Bus log provides information on all items that have been processed by xSuite Bus Prism or are currently undergoing processing.
You can use the various filter functions to change how the log is displayed, limiting it to the entries you are looking for or at least narrowing down the hit list, thus making desired information easier to find and evaluate. For instance, it is easy to set filters that will show items which encountered an error.
 |
Element | Description | |
|---|---|---|
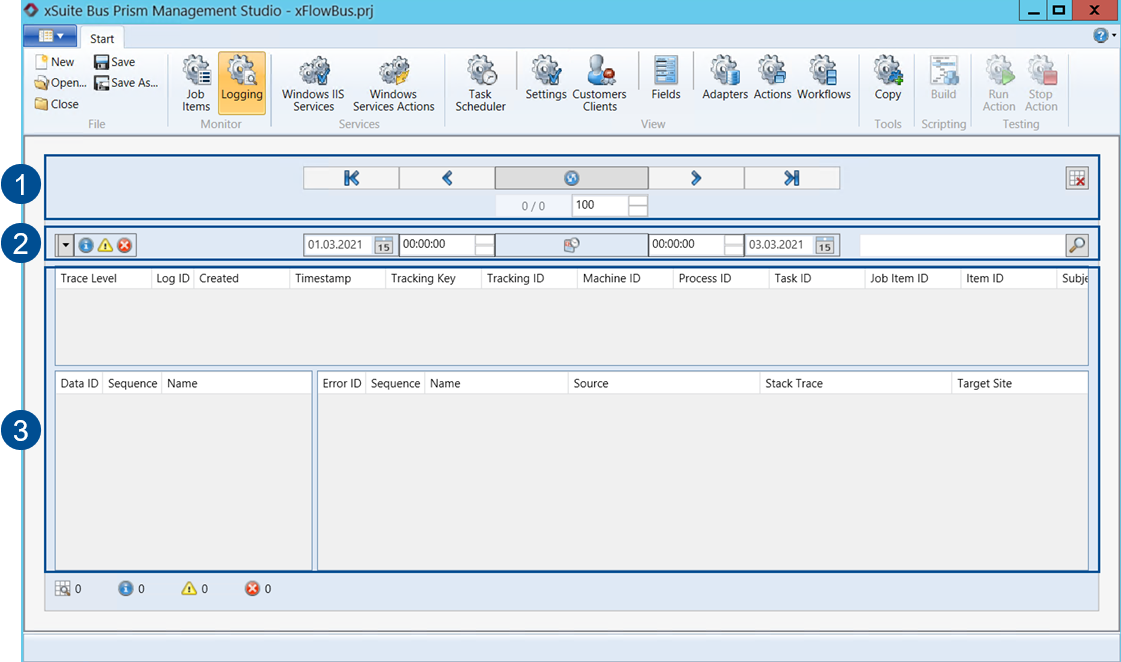
1 | Display options | The upper log section provides options for managing the way log results are displayed in the hit list. For reasons of clarity and readability, results are presented on multiple pages. The default setting is 100 items per log page. You can change this number, refresh the logging and switch between the list view pages. For more information, see An overview of display options in logging. |
2 | Filter settings | You can make your log filter settings right above the hit list. You can limit the items shown according to status, date and time. Free-text searches are also supported. For more information, see Overview of filter settings in logging. |
3 | Hit list | The actual hit list is shown below the filter options. The log hit list is divided into the Item view, Data view and Error view sections. The Item view provides a tabular overview of all output log items. The Data view section is only relevant for items that contain data. If you select an item in the Item view that has associated data, additional information will be shown here. The same applies to items where an error occurred. The Error view displays one or multiple lines that provide an extensive error description, provided that you selected one or more item lines set to Error status. This makes it easier to pin down errors and determine how to fix them. |